
Payment System Data Analytics for Bundled Payment Participants
Since the beginning of the BPCI program in 2012, Singletrack Analytics has teamed up with DataGen, a HANYS Solutions Company of the Healthcare Association of New York State, to provide applicants and participants with advanced analytical tools to assess their opportunities and performance in this program. Our BPCI Advanced and CJR analytics toolsets transform the CMS bundled payment data into a series of user-friendly dashboards that allow you to compare your performance to the expected target reconciliation rates.
Our clients benefit from a team with decades of healthcare financial experience, in-depth knowledge of payment systems and state-of-the-art analytical models to guide their decisions in this volatile area. Our approach provides a cost-effective process for guiding CJR and BPCI applicants through the participation period, and providing them with the information and tools necessary to evaluate their initiatives and project their financial results.
Episode Evaluation
Three primary metrics are used for evaluation of opportunity in the bundled payment program. First, sufficient episode volume is necessary to create financial stability and critical mass for care management. Since not all episode costs can be affected by care management, the actionable cost percentage shows the percentage of episode cost that can actually be changed. Finally, since readmission reduction is more difficult to achieve than reductions in institutional post-acute cost, the readmission percentage is a critical element in episode selection.
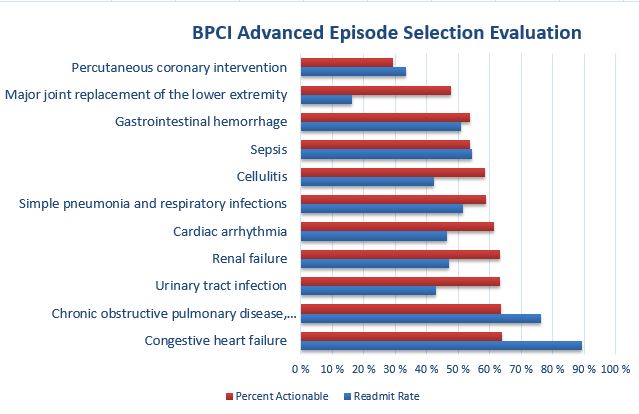
The graph above depicts this comparison, showing the percent actionable cost and readmission rate for several high-volume episode families. This graph shows that Major Joint Replacement of the Lower Extremity episodes have a high percentage of actionable cost and a low readmission percentage, indicating significant opportunity for cost savings. Congestive Heart Failure episodes have a similar percentage of actionable cost but a much higher readmission rate, indicating that cost reductions will be more difficult to achieve in these episodes. Finally, Percutaneous Coronary Intervention episodes have a relatively low percentage of actionable cost and a high readmission rate, indicating that achieving success in these episodes will be difficult.
Our Episode Evaluation reports include a number of additional reports bring insight to the services provided in these episodes, associated cost drivers, and opportunities for success.
Episode Monitoring
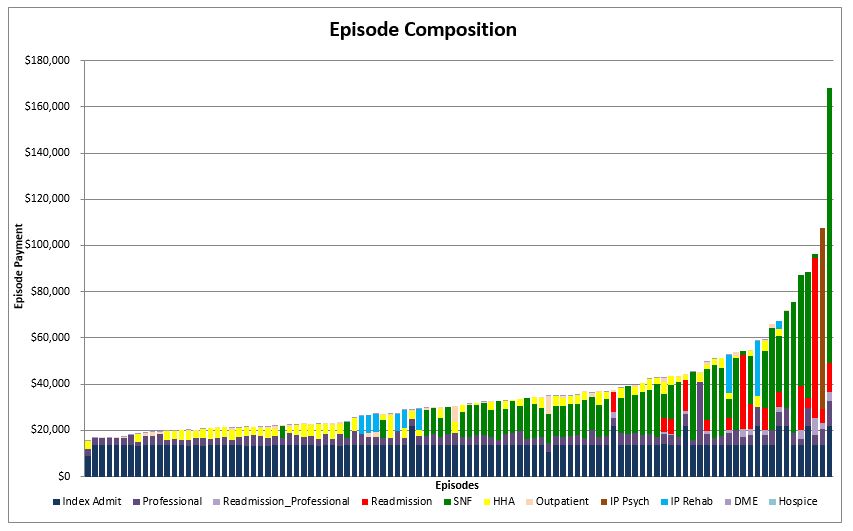
Our episode monitoring dashboards were built from our experience with more than 100 BPCI and CJR clients, and summarize the key metrics and trends that are critical for success under this program. Graphics such as the Episode Composition report shown below detail the cost drivers of each episode. Reports summarize data at high levels while allowing drill-down to claim-level detail for each episode. Maintaining claims-level data in the models enables users to sort, filter and summarize by almost every claim element, such as diagnosis code or provider specialty. Data can be easily exported from dashboards into Excel or other similar programs.
Our clients have the benefit of a team with decades of healthcare financial experience, in-depth knowledge of payment systems and state-of-the-art analytical models to guide their decisions in this volatile area. Our approach provides a cost-effective process for guiding CJR and BPCI applicants through the participation period, and providing them with the information and tools necessary to evaluate their initiatives and project their financial results.