
In Medicare bundled payment programs, episode cost targets have a major role in determining a participant's financial results. CMS establishes targets in these programs through a variety of methods, and these targets are compared with the participant’s actual episode costs to determine surplus or deficit. In the “BPCI Classic” program targets were established based on each provider's historical cost in the participating DRGs, meaning that participants who reduced cost would generally achieve surpluses, and vice versa.
In BPCI Advanced, however, targets are computed by applying three factors to the national average episode cost for each episode type. These factors adjust for the provider's historical efficiency, patient case mix, and certain provider characteristics. They increase or decrease the average national episode cost to compute the final target for each episode type. In most cases these adjustments are moderate, increasing or decreasing the target from the national average cost by only a few percent. In some cases, however, the adjustment factors are significantly larger and can themselves create a surplus or deficit for participants in that episode type. And while the overall objective of these programs is to achieve financial access by reducing episode cost, participants can occasionally “game” the system to achieve the same level of success by simply selecting episodes having highly advantageous targets.
A detailed discussion of the BPCI Advanced targets is provided in this Singletrack Analytics article, and readers should refer to that article for those details. For purposes of this article, we'll simply note that the three factors that adjust the national average cost are:
- The Efficiency factor - The Efficiency Factor (EF) allegedly accounts for the relative cost efficiency of the provider as compared a mathematically-predicted cost of the participants’ episodes (with greater efficiency represented by a lower number). Participants who are historically "efficient" will have a lower efficiency factor and hence a lower target than those who are historically "inefficient", all other factors equal. Since "inefficient" participants may have a greater opportunity to reduce cost, and will also have higher targets, a high-efficiency factor (indicating lower efficiency) is advantageous for a participant in a particular episode type. The lower target for “efficient” providers recognizes CMS's desire not to reward participants in BPCI Advanced for cost savings that they have already achieved through previous efforts.
- The Patient Case Mix Adjustment (PCMA) - The PCMA factor adjusts the national average cost (referred to as the "Dollar Amount") for the clinical complexity (and thus the higher cost) of the participant’s patients who have multiple medical conditions. Notably, this factor will change during reconciliation to reflect the complexity of patients in the actual episodes occurring during the performance period.
- The Peer Adjusted Trend (PAT) factor adjusts for various provider characteristics such as bedsizes, teaching status, and for changes in episode cost that have occurred since the baseline period.
An Excel workbook containing a table of these factors is provided to each participant for each performance year, but CMS has also released a comprehensive workbook listing all target factors for all BPCI Advanced participants. This list provides a veritable treasure trove for researchers interested in delving into the factors affecting target rates, and potential areas in which financial success may be disproportionately determined by targets.
Target math
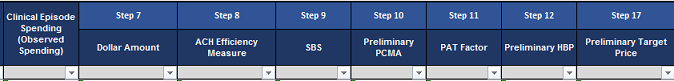
Each of the target factors is provided in the target workbooks in a table with headings like those below.
Table 1- CMS Target Worksheet
The three factors are essentially multiplied together and then multiplied by the "Dollar Amount", which is the average national cost for that episode. Thus, the product of these three factors multiplied together is the overall participant-specific adjustment, which will be referred to as the "Combined Factor" below. For example, a participant in CHF episodes having an efficiency factor of 1.02, a PCMA of 1.07, and PAT factor of .89 would have a Combined Factor of .97. This means that the target for that episode would be 97% of the average national episode cost.
Evaluating your own targets
Let’s take a look at an example of a set of targets from the CMS national target file described above.
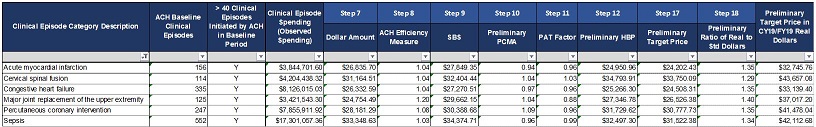
Table 2-Target Factor Examples
Baseline vs. National Episode Cost
Since target calculations begin with the "Dollar Amount" (which is the national standard cost for each episode type), it's useful to compare the participants’ average baseline episode cost to that amount. Episode types in which the baseline cost exceeds the target will require greater cost reductions in order to meet the targets unless the target adjustment factors above are sufficiently large to adjust away that difference. An example of that calculation is shown below.
Table 3-Historical Cost vs National Average
|
Clinical Episode Category Description |
ACH Baseline Clinical Episodes |
Clinical Episode Spending (Observed Spending) |
|
Step 7 |
|
|
|
|
||||
|
Current Per-Episode Standardized Cost |
Dollar Amount |
Excess Over National Cost |
|||
|
Filter |
Filter |
Filter |
|
Filter |
|
|
Acute myocardial infarction |
156 |
$3,844,702 |
$24,646 |
$26,836 |
$2,190 |
|
Cervical spinal fusion |
114 |
$4,204,438 |
$36,881 |
$31,165 |
-$5,717 |
|
Congestive heart failure |
335 |
$8,126,015 |
$24,257 |
$26,333 |
$2,076 |
|
Major joint replacement of the upper extremity |
125 |
$3,421,543 |
$27,372 |
$24,754 |
-$2,618 |
|
Percutaneous coronary intervention |
247 |
$7,855,912 |
$31,805 |
$28,181 |
-$3,624 |
|
Sepsis |
552 |
$17,301,057 |
$31,342 |
$33,349 |
$2,006 |
The “Current Per-Episode Standardized Cost” column is computed by dividing the Clinical Episode Spending column by the ACH Baseline Episodes column. It’s not part of the CMS worksheet. Similarly, the Excess Over National Cost is computed by subtracting the Current Per-Episode Standardized Cost from the Dollar Amount.
In this example the participant’s baseline cost is lower than the national average (“Dollar Amount") for AMI, CHF, and Sepsis episodes but exceeds the national average for Cervical Spinal Fusion, MJR, and PCI. Thus, the episodes highlighted in green appear to have greater financial opportunity then those in orange.
Effect of Adjustment Factors
But that's not the end of the calculation. We now need to look at each of the adjustment factors to see how they will affect the target. Those factors appear on the CMS target work book in the columns indicated below. The “Combined Factor” is the product of multiplying the three individual factors together, and shows the net effect of each of the factors on the target.
Table 4-Target Adjustment Factors
|
Clinical Episode Category Description |
Step 8 |
Step 10 |
Step 11 |
|
|
|
||||
|
ACH Efficiency Measure |
Preliminary PCMA |
PAT Factor |
Combined Factor |
|
|
Filter |
Filter |
Filter |
Filter |
|
|
Acute myocardial infarction |
1.04 |
0.94 |
.96 |
0.94 |
|
Cervical spinal fusion |
1.04 |
1.04 |
1.03 |
1.11 |
|
Congestive heart failure |
1.04 |
0.97 |
0.96 |
0.97 |
|
Major joint replacement of the upper extremity |
1.20 |
1.04 |
0.88 |
1.10 |
|
Percutaneous coronary intervention |
1.08 |
1.09 |
0.96 |
1.13 |
|
Sepsis |
1.03 |
0.96 |
0.99 |
0.98 |
The effect of each factor for this provider is as follows:
- Efficiency Factor: As noted above, the efficiency factor measures the participant’s episode cost relative to a hypothetical predicted cost based on a CMS model. In this example, the participant was relatively inefficient in each of the episode types, but particularly inefficient in Major Joint Replacement of the Lower Extremities (MJR) episodes. For MJR episodes this may mean that significant opportunities remain for cost reduction in these episodes, particularly if this participant has not previously been involved in bundled payment programs involving joint replacement and therefore hasn’t made the clinical changes that create efficiency in these episodes. The higher efficiency factor also means that the target will be increased to adjust for this "inefficiency". The relatively small Efficiency Factors in other episode types will create a modest increase in the target.
- PCMA: For this participant, the PCMA for Percutaneous Coronary Interventions (PCI) episodes is somewhat large indicating that the participant has relatively complex patients, but for most other episodes it has a relatively small magnitude. Thus, this factor is not significant in target evaluation for this participant.
- PAT Factor: For this participant these factors are not particularly significant except for the .88 factor for MJR episodes. PAT factors for MJR episodes typically range between .80 and .90, because of the overall decrease in MJR episode cost over the last several years. A low PAT factor "raises the bar" for all participants in these types of episodes. It factors in cost changes that have already occurred into the targets and requires participants to make further costs reductions to achieve financial surplus. This means that hospitals that have not already made significant reductions in episode cost must do so to break even in these episodes. Previous participants in the BPCI or voluntary CJR programs may have made these changes during or subsequent to the baseline period, in which case their current episode costs are already below those incurred during the baseline, so they may not be significantly disadvantaged by this factor. However, participants who were not be part of those programs may find these low PAT factors a significant barrier to participation
Final target evaluation
The final calculation multiplies the "Dollar Amount" by the Combined Factor to create the "Preliminary HBP”, which is the target amount before adjustment for the CMS discount. This can then be compared to the average baseline episode cost for each episode. The HBP/Baseline ratio indicates the relationship between the preliminary target and the baseline cost, with a ratio exceeding 100% showing that the target was higher than the baseline cost, and vice versa. A ratio exceeding 100% indicates that less cost reduction (or none) may be necessary in those episodes to meet the targets.
Notable for this participant is that episodes in which the historical cost significantly exceeded the national cost (indicated in red and orange) were highly affected by the target adjustments, whereas the converse was true for episodes in which the national cost was greater than the baseline cost. As a result, the Preliminary HBP is within several percentage points of the participant’s average baseline episode cost for three episodes – Acute Myocardial Infarction (AMI), MJR and PCI. The Cervical Spinal Fusion episodes had an advantageous Combined Factor of 1.11, but the excess of baseline cost over the national average cost was so great that the Preliminary HBP is 6 percentage points above the baseline cost. Consequently, significant cost reductions from the baseline levels for these episodes would be necessary to reach the targets. Conversely, for Congestive Heart Failure (CHF) and Sepsis episodes the excess of national average episode cost over baseline cost was partially negated by the combined factors (the Preliminary HBP is lower than the Dollar Amount) – the targets still exceed the baseline cost, but by less than they did before the adjustments were applied.
Table 5-Target Comparison to Baseline Cost
|
Clinical Episode Category Description |
|
Step 7 |
|
|
Step 12 |
|
|
|
|
|
|
|||
|
Current Per-Episode Standardized Cost |
Dollar Amount |
Excess Over National Cost |
Combined Factor |
Preliminary HBP |
HBP/ Baseline |
|
|
Filter |
|
Filter |
|
|
Filter |
|
|
Acute myocardial infarction |
$24,646 |
$26,836 |
$2,190 |
0.94 |
$24,951 |
101% |
|
Cervical spinal fusion |
$36,881 |
$31,165 |
-$5,717 |
1.11 |
$34,794 |
94% |
|
Congestive heart failure |
$24,257 |
$26,333 |
$2,076 |
0.97 |
$25,266 |
104% |
|
Major joint replacement of the upper extremity |
$27,372 |
$24,754 |
-$2,618 |
1.10 |
$27,347 |
100% |
|
Percutaneous coronary intervention |
$31,805 |
$28,181 |
-$3,624 |
1.13 |
$31,730 |
100% |
|
Sepsis |
$31,342 |
$33,349 |
$2,006 |
0.98 |
$32,497 |
104% |
Thus, the "bottom line" in the target analysis for this participant shows slightly favorable targets for CHF and Sepsis, slightly unfavorable targets for Cervical Spinal Fusion, and no advantage or disadvantage for the remaining episodes.
Winners and Losers Among Episodes
Most episode types have no inherent opportunity for success, but a few episode types appear to consistently generate targets higher than the national average episode cost. Other episode types generally create targets lower than the national average cost. Since higher targets are more attractive than lower targets, episodes with significantly high Combined Factors (and therefore higher targets) may overall be more attractive than those with significantly lower Combined Factors. Let’s see how that looks in the national CMS target data.
From the national target file we can extract an average each of the four factors described above for each episode type, and can note how these factors differ. The table below shows these averages across all participants, with coloring indicating the relative values of these factors. Several observations are interesting, notably that some episodes have significantly lower Combined Factors (and therefore less opportunity for financial success) than other episodes. For example, Back and Neck except Spinal Fusion episodes have an average Combined Factor of 1.07, meaning that the average target for these episodes is 7% higher than the average national episode cost – the “average” participant would have a 7% surplus (before the CMS “discount” is applied) in these episodes. Conversely, Simple Pneumonia and Respiratory Infection episodes have an average Combined Factor of .93, meaning that the average target for these episodes is 7% lower than the average national episode cost and the “average” participant would have a 7% loss on these episodes. While few participants are “average”, the significant disparity in these factors indicates a general favorability for certain episodes and disfavorability for others. This potential target bias may affect participation in several episode families as participants realize the relative advantages of targets among the episodes available for participation.
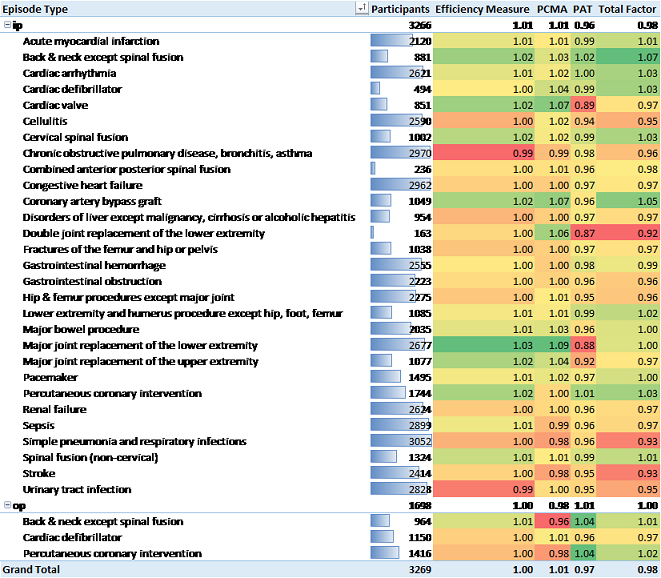
Table 6- Average Target Factors for All Participants by Episode Type
Participants who can’t lose – or win
But even more interesting than the difference in targets among episode types is the difference within an episode type across different providers. The earlier analysis describes the process that an individual participant would perform to evaluate their target opportunities in BPCI Advanced. The analyses for most participants will be similar to that shown above – there may be a few episodes in which the targets create a slight advantage or disadvantage. However, some participants appear to have the targets stacked in their favor for a large number of episodes, while other participants don’t appear to be able to succeed in any episodes.
The former situation occurs when the Combined Factors many episodes for a participant are significantly above 1.0, indicating that the targets will significantly exceed the national average episode cost. This doesn’t necessarily guarantee a financial surplus for the participant since their own episode cost may exceed the national average, but it provides for a higher target than other participants will receive for the same episode and thereby facilitates the ability of those participants to achieve a surplus.
Individual differences in targets
The set of graphs below show the values of each of the four factors in Sepsis episodes for each of the 2899 participants in that episode type. As can be seen, the median value of the Efficiency and PCMA factors is close to 1.0, with some values slightly lower and some slightly higher. The PAT factor is lower than 1.0 for about 80% of participants, but increases significantly for few participants have the right side of the graph. The Combined Factor graph shows the product of the other three factors and indicates that about 3/4 of participants will have a Combined Factor lower than 1.0, meaning that the targets will be established below the national average cost.
What's notable here, though, is what happens at the right end of this graph. About a quarter of participants will have targets that are significantly higher than the national average, some of which are 50 – 100% larger. Those participants are virtually guaranteed financial success regardless of their episode cost. Participants who identify advantageous targets can elect to participate in those episodes with little financial risk; therefore identifying episodes having highly advantageous targets should be part of every participant’s episode selection process.
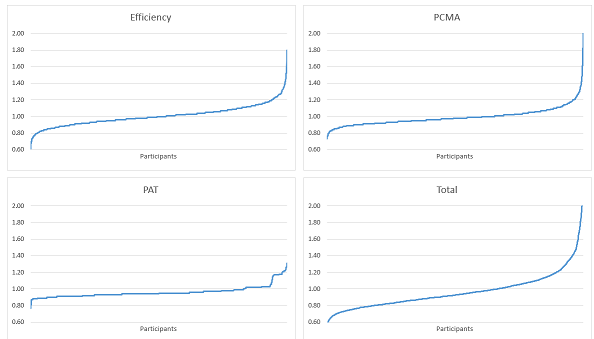
Figure 1-Individual Target Factors by Participant - Sepsis
This phenomenon occurs in other episode families, primarily those with high Combined Factors in Table 6 above.
Hospital Winners
The example above shows how individual participants can sometimes have advantageous targets in selected episode types, but some hospitals just seem to be lucky! The hospitals below have target factors that are all larger than 1.0, with targets and some episode types significantly higher.
|
Episode Type |
Episode Count |
Combined Factor |
|
Sample Hospital A |
10824 |
1.16 |
|
Chronic obstructive pulmonary disease, bronchitis, asthma |
1715 |
1.18 |
|
Congestive heart failure |
2219 |
1.12 |
|
Major joint replacement of the lower extremity |
1320 |
1.03 |
|
Renal failure |
1266 |
1.07 |
|
Sepsis |
1283 |
1.41 |
|
Simple pneumonia and respiratory infections |
1714 |
1.17 |
|
Urinary tract infection |
1307 |
1.13 |
|
Grand Total |
10824 |
1.16 |
|
Episode Type |
Episode Count |
Combined Factor |
|
Sample Hospital B |
6385 |
1.21 |
|
Chronic obstructive pulmonary disease, bronchitis, asthma |
1463 |
1.06 |
|
Congestive heart failure |
1213 |
1.21 |
|
Sepsis |
1387 |
1.42 |
|
Simple pneumonia and respiratory infections |
1102 |
1.23 |
|
Urinary tract infection |
1220 |
1.15 |
|
Grand Total |
6385 |
1.21 |
This phenomenon occurs at the other end of the risk factor scale too, with some hospitals’ targets set significantly below the regional average, as shown below.
|
Episode Type |
Episode Count |
Combined Factor |
|
Sample Hospital C |
9466 |
0.82 |
|
Chronic obstructive pulmonary disease, bronchitis, asthma |
1027 |
0.89 |
|
Congestive heart failure |
1648 |
0.85 |
|
Major joint replacement of the lower extremity |
2392 |
0.75 |
|
Sepsis |
3247 |
0.77 |
|
Simple pneumonia and respiratory infections |
1152 |
0.84 |
|
Grand Total |
9466 |
0.82 |
So while CMS certainly intends BPCI Advanced to be a program in which financial success accrues to participants who can create clinical change, a few hospitals could participate in several episodes and be virtually guaranteed financial success with no clinical change necessary. And while this situation may be acceptable in a voluntary program in which no hospital with disadvantageous targets is forced to participate, it would have significant implications for mandatory programs in which all participants must participate.